How to Export MT5 Trading History Into a Trading Journal
Export your MetaTrader 5 trading history as an HTML report or with an EA, know which fields matter, and import or auto-sync it into a PlanningTrade journal.
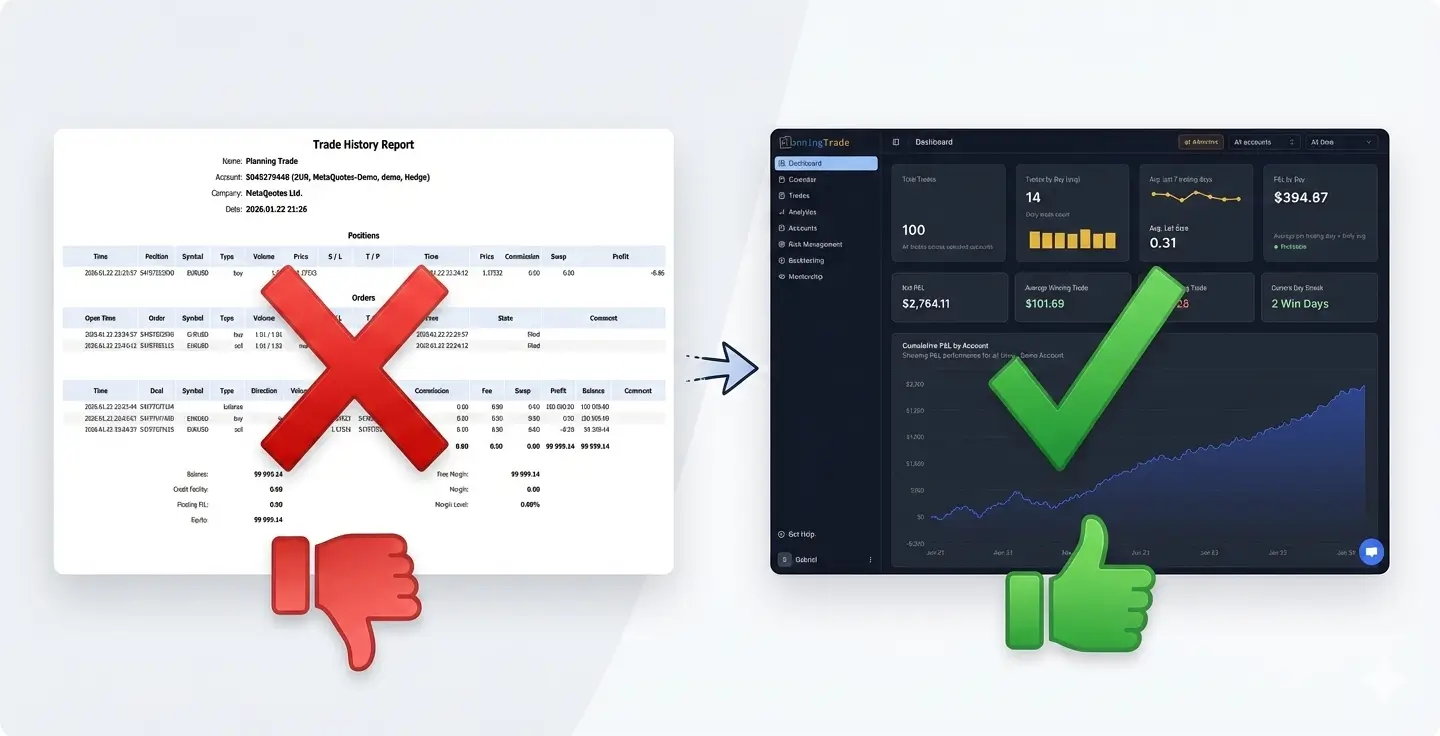
Short answer: to export your MetaTrader 5 trading history, open the Toolbox (Ctrl + T), go to the History tab, right-click, choose All history, then right-click again and pick Report → HTML. That file can be imported into a journal such as PlanningTrade in a few clicks, or you can skip exports entirely with MT5 auto-sync. The full steps, the fields worth keeping, and what a useful dashboard looks like are below.
MetaTrader 5 stores a wealth of useful trading data, but the platform wasn’t designed for deep analysis. The built-in reports are functional, but they won’t help you spot patterns, track risk behavior, or understand why your equity curve looks the way it does.
If you want to genuinely understand your performance and improve it, you need to extract that data and present it in a way that reveals insights rather than hiding them in endless rows of numbers.
This guide walks you through the practical methods for exporting MT5 data, explains what a useful trading dashboard actually looks like, and shows how PlanningTrade takes you from raw export to a working journal in minutes.
What Data You Actually Need from MT5
Before exporting anything, it helps to know which fields matter. At minimum, your journal needs:
- Open time and close time for duration analysis
- Symbol to track performance by instrument
- Side (buy or sell) for directional analysis
- Volume to calculate risk exposure
- Entry price and exit price for accuracy verification
- Net profit as your bottom line metric
- Commission and swap because these eat into real returns
- Ticket or position ID for record matching
- Account and broker info if you trade multiple accounts
Beyond the basics, these fields add significant analytical value:
- Stop loss and take profit levels to measure execution against plan
- Magic number and comments for EA identification
- Setup tags or entry reasons which you’ll typically add in your journal
The more context you capture, the more useful your analysis becomes. But even the minimum fields can reveal a lot when displayed properly.
Option 1: Manual HTML Report Export from MT5
This is the most straightforward method and works for every MT5 user regardless of broker or account type.
Step-by-step process:
- Open MetaTrader 5
- Go to the Toolbox panel (press
Ctrl + Tif it’s not visible) - Click on the History tab
- Right-click anywhere inside the history table
- Select “All history” to ensure you’re capturing everything
- Right-click again and choose Report, then HTML (Internet Explorer)
- Save the file somewhere you’ll remember
MT5 also offers Open XML (MS Office Excel) in the same Report menu if you want to work in a spreadsheet. For importing into a journal, the HTML report is the one to use.
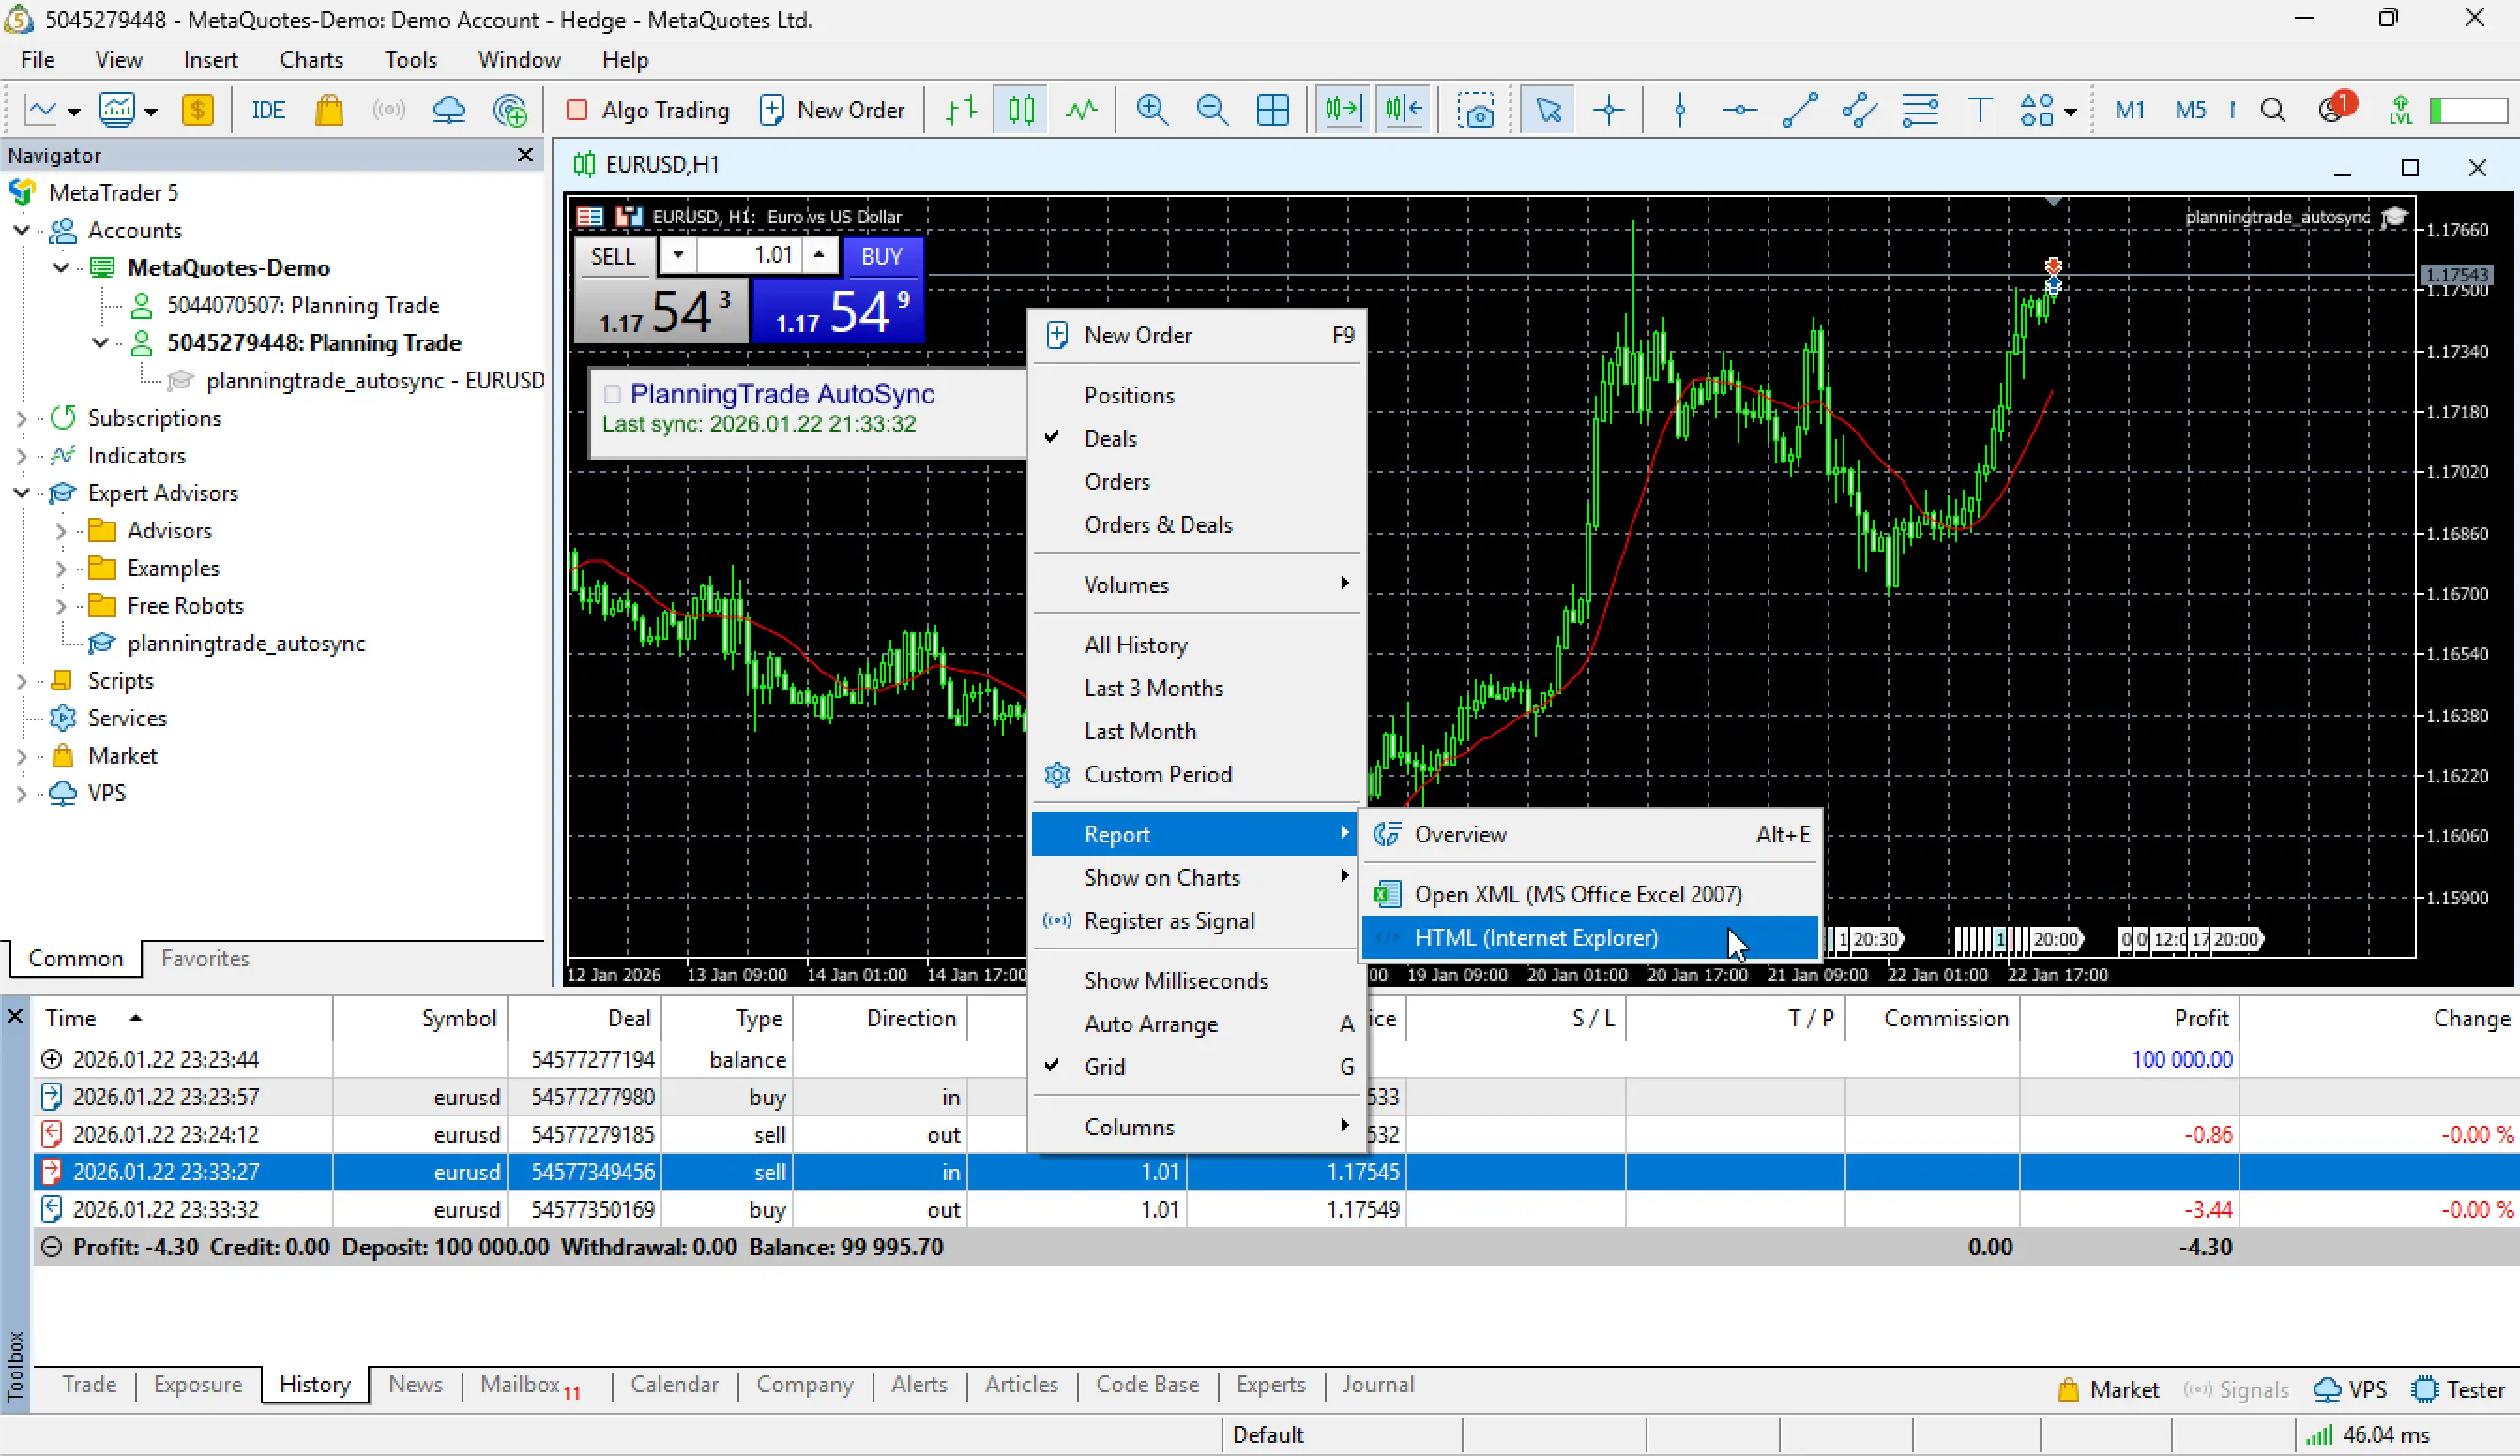
The HTML file contains all your closed trades with the essential fields. It’s not pretty, but it’s complete and accurate.
When this method works well: Occasional exports, single accounts, traders who don’t mind a bit of manual work.
When it falls short: Multiple accounts, frequent trading, or when you need data synced regularly without remembering to export.
Option 2: Automated Export with an MT5 Expert Advisor
If you trade frequently or manage multiple accounts, manual exports become tedious quickly. An EA-based exporter solves this by automating the process.
A well-designed exporter EA can pull closed trades and deals automatically, normalize fields like commission, swap, and profit into consistent formats, include metadata such as magic numbers, comments, and SL/TP levels, and run on a schedule so your data stays current.
This approach is particularly valuable if you trade across multiple accounts or brokers, need accuracy without manual verification every time, or want to eliminate the “I forgot to export” problem entirely.
Several free and commercial MT5 export EAs exist. Look for one that outputs clean CSV or JSON files, as these formats are easier to work with downstream.
What Good Data Display Actually Looks Like
Raw trade lists are overwhelming. A table with 500 rows of trades tells you almost nothing at a glance. The point of a dashboard isn’t to show all your data; it’s to answer specific questions quickly.
Question 1: Is my profitability real or just luck?
A single profitable month might come from one outsized winner. Your dashboard should reveal whether your results are consistent or fragile.
Display equity curves that show the journey, not just the destination. Add daily P&L bars to see volatility in your returns. Include rolling averages and rolling win rates to spot trends over time.
Question 2: What does my actual risk behavior look like?
What you think your risk management looks like and what the data shows are often different. Good display makes this gap visible.
Track average loss versus average win to understand your reward profile. Show maximum drawdown at both daily and overall levels. Visualize loss streak distribution to see how bad the bad stretches really get. Normalize P&L by risk using R-multiples so you can compare trades taken with different position sizes.
Question 3: Where are my strengths and weaknesses?
Aggregate numbers hide important details. Breaking down performance by different dimensions reveals where your edge actually lives.
Analyze results by symbol to find which instruments you trade well. Compare sessions like Asia, London, and New York to see if timing matters. Look at day of week patterns since many traders have predictable weak days. Separate long versus short performance because directional bias is common. If you tag trades by strategy, compare those strategies against each other.
Question 4: Am I actually consistent?
Consistency matters more than occasional brilliance. Your dashboard should make consistency visible and measurable.
Track your percentage of green days as a simple consistency metric. Count rule violations if your journal supports this. Calculate the percentage of trades where you exceeded your planned risk. Monitor profit factor stability over time rather than just the overall number.
A Clean Dashboard Layout That Works
Some layouts are consistently more useful than others. Here’s a structure that balances overview with diagnostic depth.
Top row: Key performance indicators
Display net P&L, win rate, profit factor, maximum drawdown, and average R or expectancy as cards or large numbers. These give you the instant health check.
Middle section: Performance visuals
Show the equity curve for overall trajectory, daily P&L bars for recent performance texture, and a drawdown curve to visualize recovery patterns. These three charts together tell most of the story.
Bottom section: Diagnostic breakdowns
Include tables for symbol performance showing P&L, win rate, and profit factor per instrument. Add session and day-of-week breakdowns. If you use strategy tags, show strategy-level metrics. Finally, list your biggest wins and losses for targeted review.
This layout answers the major questions without overwhelming you with data. You can drill deeper when needed, but the surface level remains clean.
Where PlanningTrade Fits In
Manual MT5 exports work fine until they don’t. Most traders hit friction points that make the process unsustainable over time.
Common problems with manual workflows:
Multiple accounts create organizational chaos. Each broker names symbols slightly differently, so EURUSD on one platform becomes EURUSD.a on another. Commission and swap handling varies, making apples-to-apples comparison difficult. You end up spending more time cleaning data than learning from it. And even when the data is clean, raw statistics without risk-rule context don’t help you improve discipline.
How PlanningTrade solves this:
The platform is designed specifically for that messy middle ground between raw export and actionable insight.
You can auto-sync your MT5 account so manual exports become optional. The sync is designed to be IP-friendly: it does not create extra login events or new IP addresses, which matters if you trade a prop firm account that monitors for unusual logins. (Always confirm your firm’s policy.) MT4 and cTrader sync the same way, and NinjaTrader and Tradovate are covered in our futures auto-sync guide.
Once trades are in, the system normalizes your data, handling symbol variations and fee inconsistencies across brokers. Performance displays are built around a risk-first perspective, showing prop firm metrics, drawdown tracking, and daily limit monitoring alongside traditional statistics, and every synced trade is evaluated against the risk rules you set.
Review becomes intuitive with breakdowns by strategy, session, or symbol. Everything is shareable for mentor and coach workflows or simply for your own multi-account overview. And the dashboard includes all the analytical features described above without requiring you to build anything yourself.
If your goal is not just seeing results but building consistency, the risk-management lens matters. Most dashboards show you what happened. PlanningTrade helps you understand whether what happened followed your rules.
Practical Tip: Always Validate Your Imports
Whether you use a spreadsheet, a custom script, or PlanningTrade, validation is not optional. Journals are only useful if the underlying data is accurate.
Check these items after every import:
Verify that total net profit matches your MT5 report exactly. Confirm the number of trades or deals matches what you expect. Ensure commission and swap are included consistently, not sometimes captured and sometimes missing. Double-check that timezones make sense, especially if you filter by session. A trade that looks like a London session entry might actually be New York if your timezone settings are wrong.
Catching data issues early saves you from drawing conclusions based on faulty information.
How to Import MT5 History into PlanningTrade
If you want to skip the manual dashboard building and get straight to analysis, here’s how to bring your MT5 HTML report into PlanningTrade. The free plan is enough for this; no card is required.
Step-by-step process:
- Create a free PlanningTrade account, then add a trading account representing your MT5 account
- Navigate to Trades and click Add Trade
- Click on the Import tab
- Select the account you just created from the dropdown
- Choose MetaTrader 5 in the broker format dropdown
- Upload the HTML file you exported from MT5
- Click Import
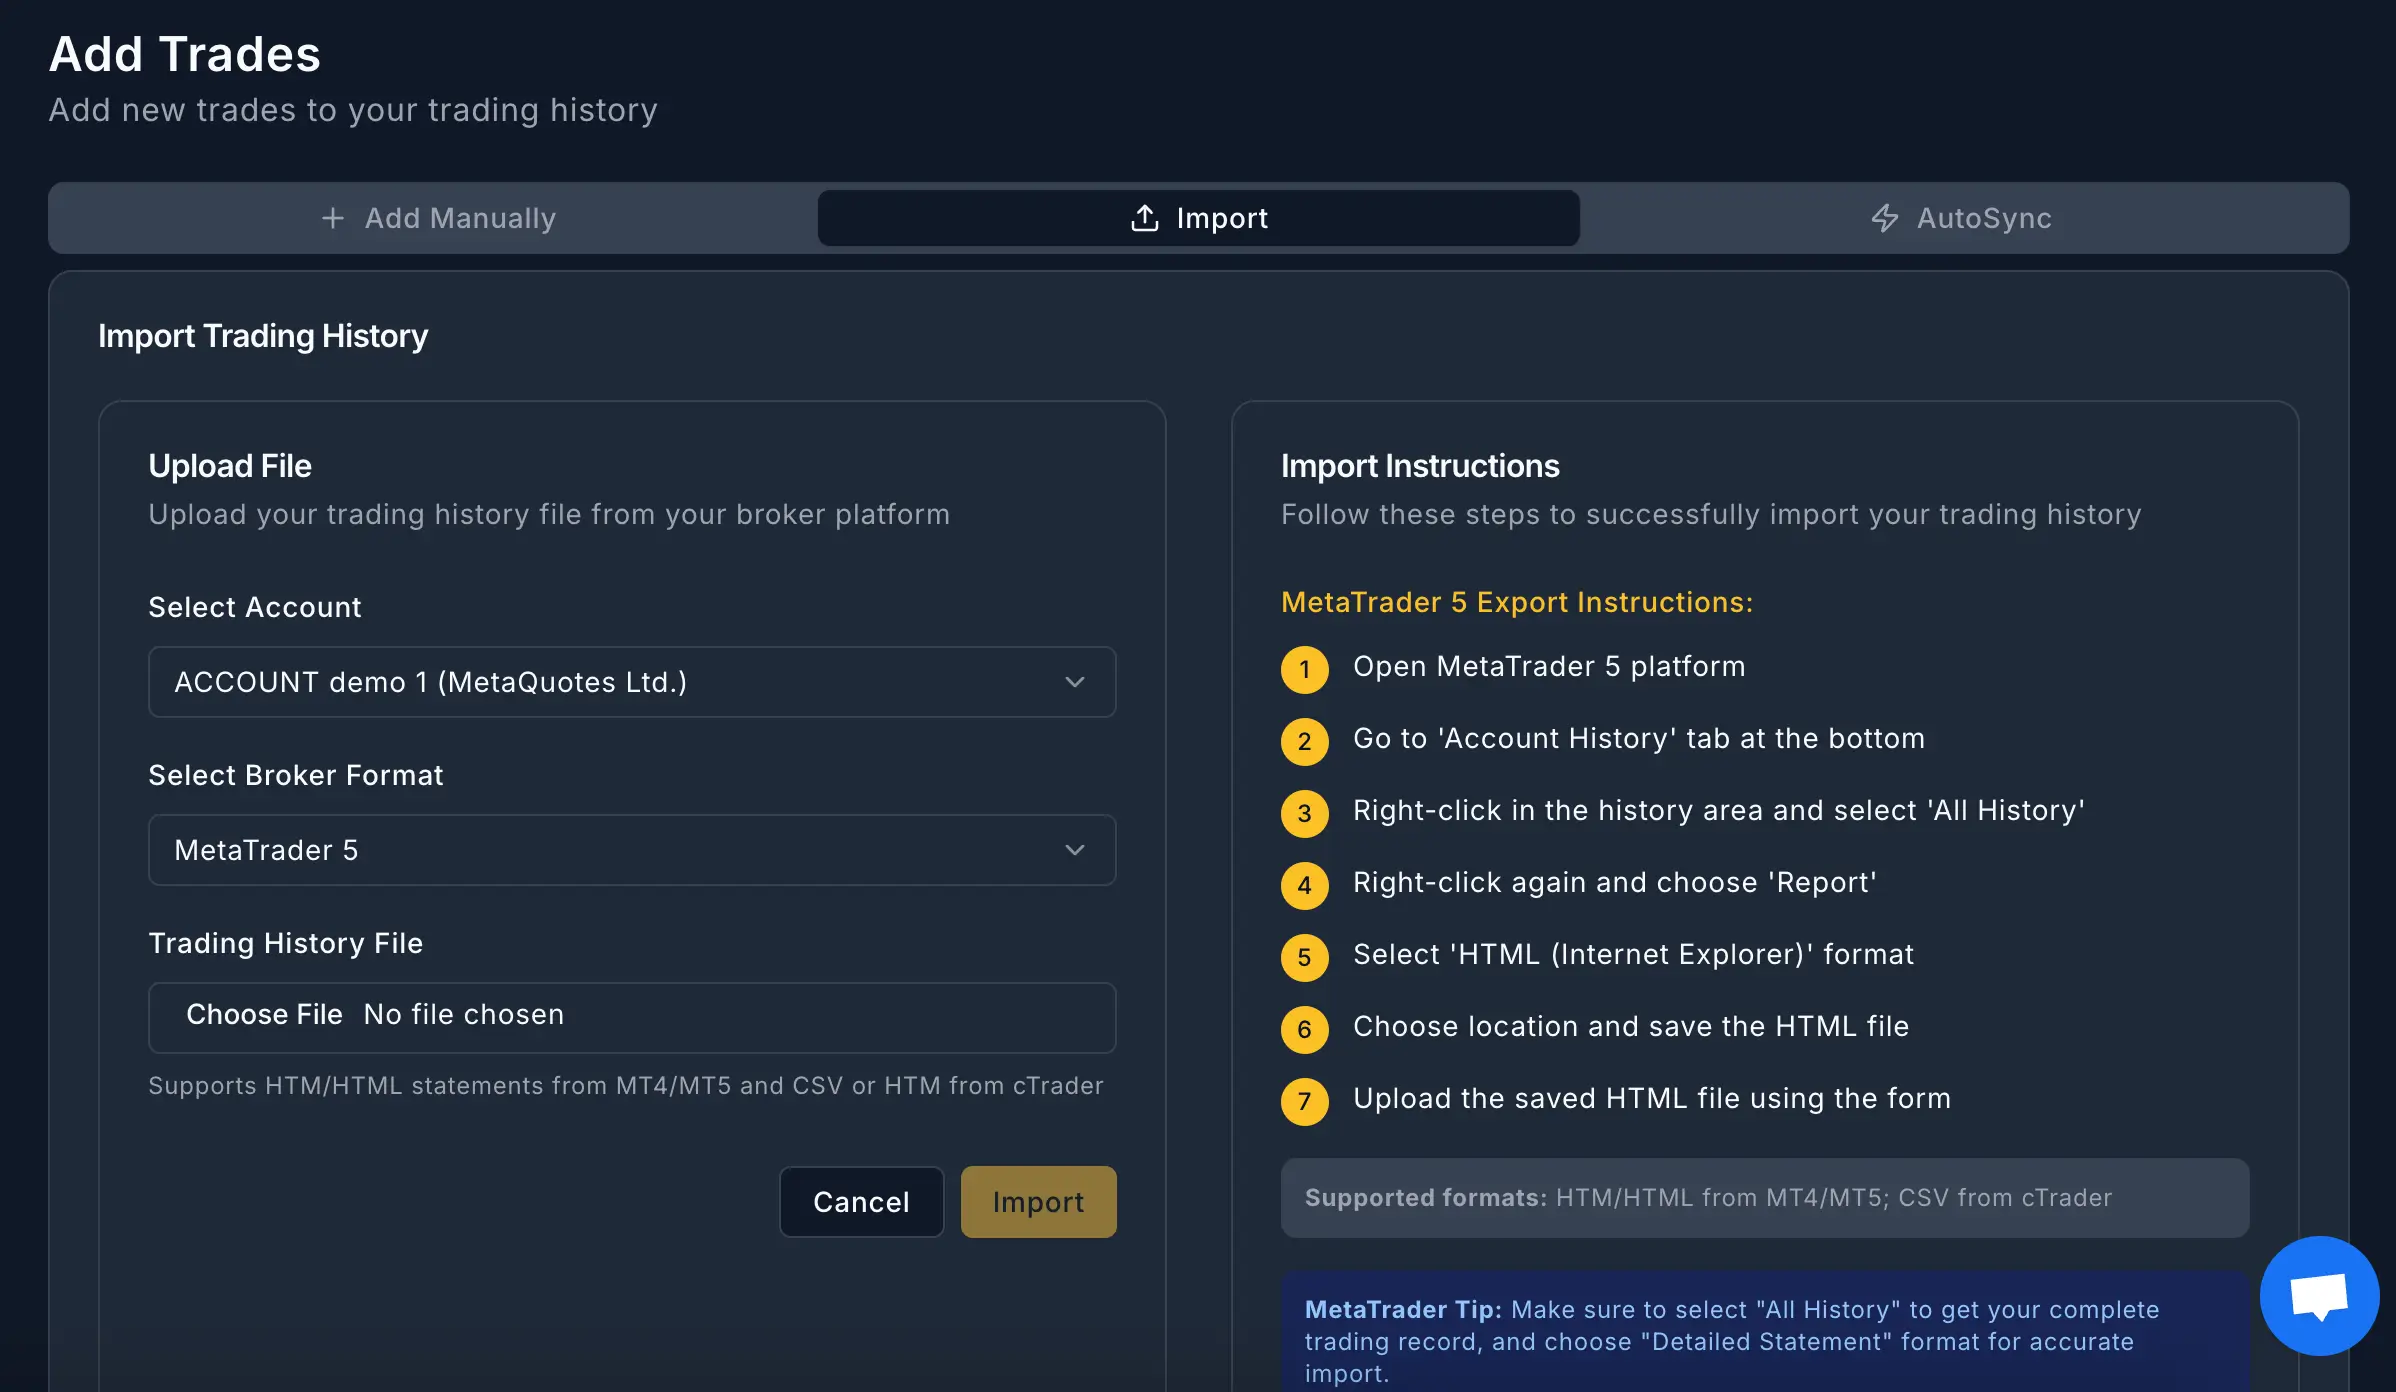
Once the import completes, your trades appear on the Trades page and your dashboard updates automatically with all the analytics and risk metrics. No spreadsheet formulas, no manual calculations, no data cleaning required.
From there, you can start tagging trades with setups, reviewing performance by the dimensions that matter to you, and building the consistency habits that separate profitable traders from everyone else. A good first stop is the calendar view; our guide to reading a trading journal calendar explains what to look for and what to ignore.
FAQ
Can MT5 export trading history to CSV? Not directly. The History tab’s Report menu offers HTML and Open XML (Excel). Save the Excel version and export it to CSV from a spreadsheet if you need CSV, or import the HTML report straight into PlanningTrade.
How do I export the full account history, not just recent trades? Right-click inside the History tab and choose All history before generating the report. The default period filter otherwise limits what the report contains.
Do I still need to export if I use auto-sync? No. With PlanningTrade’s MT5 auto-sync, closed trades arrive in the journal automatically. The HTML import is useful for loading history from before you connected, or for accounts you don’t want to connect.
Will connecting my MT5 account to a journal trigger my prop firm’s IP checks? PlanningTrade’s sync is designed to avoid extra login events or new IP addresses. Policies differ between firms, so confirm with yours before connecting an evaluation or funded account.
Which journals import MT5 reports? Most do in some form. If you are comparing options, see 3 best trading journals in 2026.